Zünd Connect
The Zünd Connect monitoring tool helps users recognize potential areas for optimizing the digital cutting process. Zünd Connect compiles production data from integrated cutting systems into meaningful key performance indicators, such as cutter capacity, availability, and Overall Equipment Efficiency.
Reasons for Zünd Connect
- Zünd Connect – helps pinpoint areas in the production workflow that show potential for improvement.
- Zünd Connect – provides a visual representation of how frequently different materials, tools, methods, or tool inserts were used and identify possible sources of errors.
- Zünd Connect – offers answers to questions, such as "When do interruptions occur most often?", "When are there periods of unused machine capacity?", and "How much time is spent in setup and switchovers?"
- Zünd Connect helps you identify shifts that might benefit from additional training.
- Zünd Connect helps you recognize patterns in frequently occurring interruptions.
- Zünd Connect identifies the potential need for additional personnel or for adding additional automation features to existing
cutting equipment.
License model versions
Zünd Connect is available in a "Monitor" and an "Analyzer" license model. It is compatible with the cutter software ZCC Version 3.5.x and version 4.5.0.
As the name suggests, the "Monitor" version consists of a graphic display of Overall Equipment Efficiency and is available for free for all ZCC users.
"Analyzer" provides the user with tools to analyze production data and identify the source of losses. "Analyzer" makes it possible to analyze the cutting workflow and develop recommendations for improvements.
Performance data at a glance
Zünd Connect gives you access to relevant key figures on factors like capacity, availability and overall equipment effectiveness. These key performance indicators provide transparency and pinpoint potential for optimization in your production workflow. Downtimes, machine capacity and causes of interruptions are conveniently displayed on the dashboard.
High Productivity
High machine availability and productivity are essential for profitable digital cutting. This is where Zünd Connect comes in. The web-based monitoring tool provides cutter performance data at a glance, at all times. With Zünd Connect, you have access to reliable key performance indicators you can use to make your production workflow even more productive.

KPI at a glance
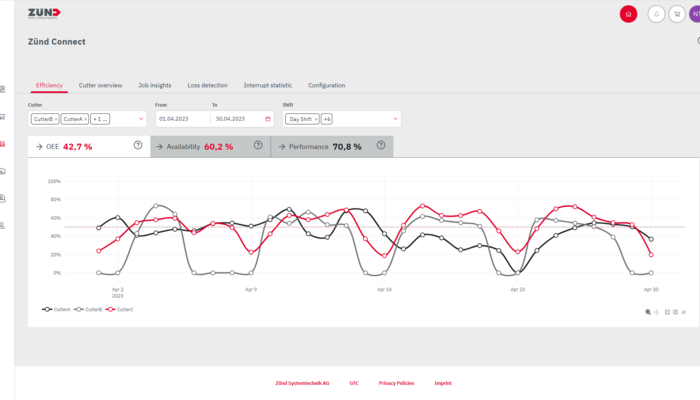
Zünd Connect displays past production data, e.g. days with poor cutter utilization. The user can choose different views and switch between them to compare indices for OEE (Overall Equipment Efficiency), availability, and capacity. The data can be filtered for certain shifts in order to compare their performance with those of other shifts and identify a possible need for training.
Cutter Overview
Cutter Overview in Zünd Connect shows all cutters and active jobs in real-time. It gives the operator a real-time status overview of every cutter and every job.
Along with the display showing overall equipment effectiveness, the Cutter Overview feature comes with the free Monitor license.
The user has the ability to display the status of the cutters on a separate monitor, e.g. on the production floor. At the same time, the production manager in the office can also keep an eye on current cutter status at all times using MyZund.
Job duration, expected time of completion, potential delays due to interruptions, and job details can all be viewed using Cutter Overview.

Job list
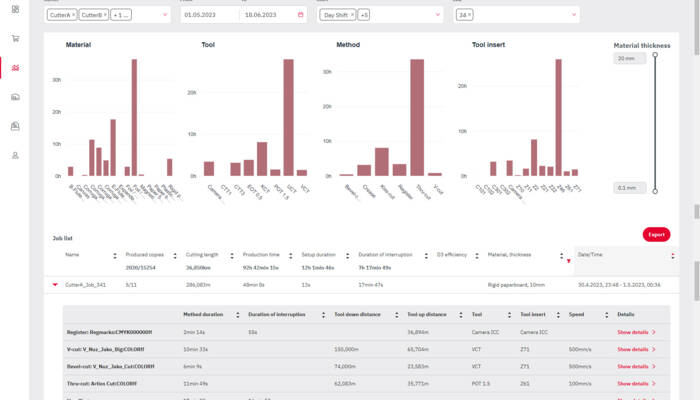
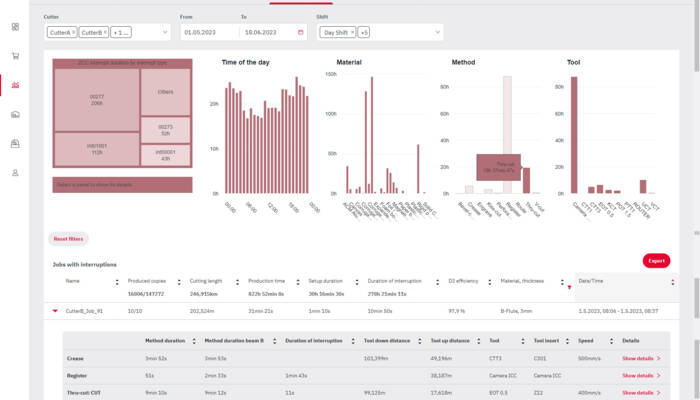
The job list contains a list of processed jobs, what they entailed, the time it took to produce them, and the cutting distance traveled per job. Diagrams show processing times for individual materials, tools, methods, and tool inserts. Bar graphs for different materials, for example, illustrate the time spent processing each one during a specified period.
Loss detection
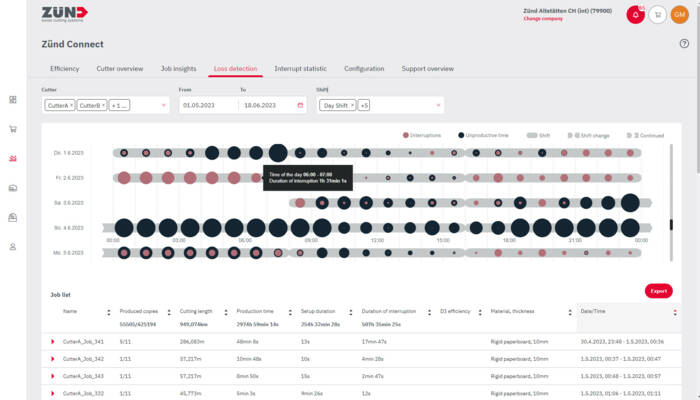
This view displays losses incurred in terms of time. It shows, for example, when production interruptions happened most often and resulted in losses. Bubbles represent these losses. A larger bubble indicates a greater loss. Losses in terms of availability and capacity are shown separately. This ensures jobs that have led to significant losses can be tracked down and examined more closely.
Loss detection lets the user examine specific time periods, materials, and tools that may be associated with machine interruptions.
Interruption statistics
Interruption statistics display the causes for interruptions. The user can filter for time of day, material, method, or tool insert. This statistics view shows how many hours during a specified period cutting systems were not producing because of machine interruptions.
REST-API
REST-API (Representational State Transfer - Application Programming Interface) can be used to query production data collected about Zünd Connect and, for example, integrate it into an MIS or ERP system. In addition, the interface can also be used to query production data about another application, such as MS Excel, and evaluate it in more depth.